Building an IV plotter from an Arduino Nano - Adding it all up
Just do the easy stuff in the Arduino.
Building an IV plotter from an Arduino Nano - Table of Contents
I’ve finally gotten back to the IV plotter. I’ve been up to other things, and for a while there I wasn’t spending much time on hobby stuff (I was playing couch potato, if you must know.)
I left off after explaining how I did the current measurements.
I’m going to explain the oversampling now, and I’ll explain the simple Python program for collecting the data in a later post.
I originally implemented oversampling in this project because I didn’t think the 10 bit resolution of the Arduino would be enough. It’s hard to tell, though, because the filtered bias voltage from the PWM output is so noisy that you can’t see the fuzz from noise for all the jaggies from the PWM.
Oversampling covers both bases, though, so I guess it doesn’t matter.
Oversampling consists simply of reading the same voltage many times, and averaging all the values into a single number. It reduces noise and improves resolution at the same time.
Oversampling does require one thing, though. You’ve got to have noise.
You read that right. To make use of oversampling, your signal has to have noise that is at least as large as the smallest value your analog to digital converter can resolve. For the Arduino, that’s 5 millivolts.
I’ve got noise. Boy, oh, boy, have I got noise.
The reason you need noise is because when all your values are the same then averaging won’t change anything. Say I’ve got the following data:
| Some voltages | Some ADC measured voltages |
|---|---|
| 1.001 | 1.000 |
| 1.002 | 1.000 |
| 1.003 | 1.000 |
| 1.002 | 1.000 |
| 1.002 | 1.000 |
The ADC can only measure to the next 5 millivolts, so all the real voltages turn out the same as far as the ADC is concerned. Averaging doesn’t gain me anything - my signal is too clean. An average just gives me 1 volt.
Now the same thing but I’ll add some noise:
| Some voltages | With some added noise | Some ADC measured voltages |
|---|---|---|
| 1.001 | 1.002 | 1.000 |
| 1.002 | 1.005 | 1.005 |
| 1.003 | 1.002 | 1.000 |
| 1.002 | 1.002 | 1.000 |
| 1.002 | 1.001 | 1.000 |
That’s with some random +-3 millivolts added to each value. Now the average is 1.001, which is a bit closer to the real average of 1.002 for the real voltages.
More values helps, of course. I went for averaging 256 measurements in the Arduino IV program. That gets me about 4 bits of additional resolution - but it takes 256 times as long to make the measurements.
The relationship is for $n$ bits of additional resolution you have to average $4^n$ measurements. If you wanted to gain 6 bits (from 10 bits to 16 bits,) you’d have to oversample by $4^6=4096$ times. That might be worth it with a much faster ADC, but with the Arduino you’d be waiting a very long time.
How helpful is it? Judge for yourself.
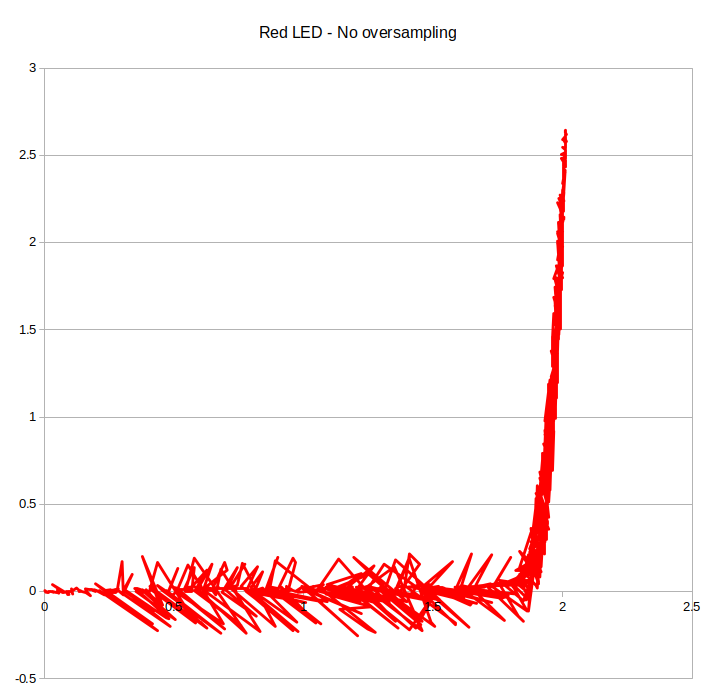
I made IV plots of a red LED with and without oversampling.
| No oversampling | Oversampled |
|---|---|
 |
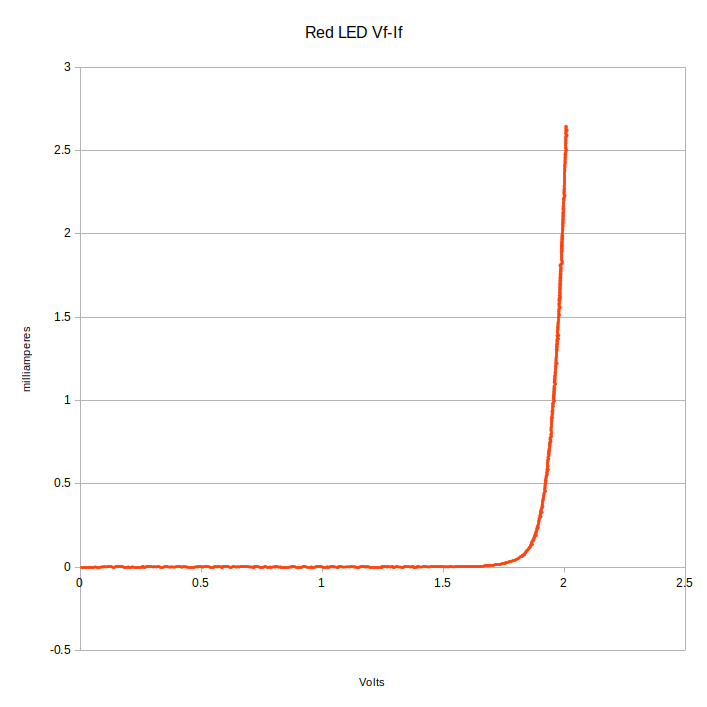 |
You can see the shape of the curve, but that’s about it. The oversampling makes a world of difference.
I didn’t put all of that load on the poor little Arduino. The Arduino only samples and sums three channels - it doesn’t calculate the average. It does the sums because sending that amount of data to the PC to be handled would take too long. The Arduino can do the sums faster than it can communicate the raw data.
Here’s the central part of the Arduino program that collects the data:
void makeMeasurementsAndSendMessage(){
    long counter = OVERSAMPLING;
    unsigned long VBias = 0;
    unsigned long VBase = 0;
    unsigned long VCollector = 0;

    while (counter--){
      VBias = VBias + analogRead(A0);
      VBase = VBase + analogRead(A1);
      VCollector = VCollector + analogRead(A2);
    }
    Serial.println(String(VBias) + "\t" + String(VBase) + "\t" + String(VCollector));
}
“OVERSAMPLING” is DEFINED to 256 earlier in the program. That’s $4^4$ for 4 bits of additional resolution. It just reads and sums the ADC values, then sends them back in a tab separated string to be handled on the PC side.
If you’d like to play around with it, I’ve placed the Arduino program and the current simple Python program in a GitHub repository.
Edit 2020-01-06 I’ve moved all the code to a new repository after finally giving the project a name. The command line program (IV.py) is in the folder named “Deprecated.” The Arduino code is in the folder named “Rodriguez.”
Load IVTracer.ino in your Arduino, hook it up as shown in the last IV posts, then run the IV.py program to collect the curve data.
I haven’t written up any instructions for using IV.py yet - that’s the next post (or the next, next, next post. Who knows.) For now you’ll just have to read the Python code and figure it for yourself.
Building an IV plotter from an Arduino Nano - Table of Contents