Building an IV plotter from an Arduino Nano - A simple Python program to get started
Just doing some math and writing a bunch of numbers to a file.
Building an IV plotter from an Arduino Nano - Table of Contents
I have started work on a Python and PyQt5 program to make IV charts using the Arduino, and discovered that I’m going to have to change things around a good bit.
The data I’ve been gathering is adequate for plotting $V_f$ vs. $I_f$ for LEDs, but I need to do more to properly characterize transistors.
I’m going to describe the little Python command line program I’ve been using. In a later post I’ll try to explain what I need change to do things correctly. Spoiler: I’m going to have to make changes to the software (PC and Arduino) and extend the Arduino circuitry a bit.
In light of the coming changes, I’m only going to explain the parts that I use for making IV plots of diodes.
The simple program I’ve been using is available in a repository on Github, if you want to do something with it.
EDIT 2021-01-03: I’ve moved all the code for the IV tracer to the Rodriguez repository. IV.py is in the folder named “Deprecated.”
I’m going to discuss just a stripped down (not like there’s all that much there to begin with) version that contains only the bits needed to do an IV plot of a diode.
Here’s the guts of the program:
with open('IV.csv', 'w') as IVFile:
    #Set the output to zero volts.  Read and discard the first values.
    serialport.write(("0"+chr(13)).encode())
    valuestring = serialport.readline()
    for counter in range(0 , 1023):

        serialport.write((str(counter)+chr(13)).encode())
        valuestring = serialport.readline()
        stringvalues = valuestring.split(('\t').encode())

        vBias = (float(stringvalues[0])/1023) * 5 / 256
        vBase = (float(stringvalues[1])/1023) * 5 / 256
        vCollector = (float(stringvalues[2])/1023) * 5 / 256

        print("Count: " + str(counter) + " VBias= " + str(vBias) + " VBase= " + str(vBase) + " VCollector= " + str(vCollector))


        V = counter/1023 * 5
        IBase = ((vBias-vBase)/1000)
        ICollector = (5.0-vCollector)/1000.0
        #Amperes to milliamperes
        IBase = IBase * 1000.0
        ICollector = ICollector * 1000.0
        IVFile.write( str(V) + "\t" + str(vBias) + "\t" + str(vBase) + "\t" + str(IBase) + "\t" + str(ICollector) + "\r\n")
Honestly, it’s pretty simple. Standard stuff: Writing and reading from a serial port, some math, writing to a file.
Hitting the highlights:
with open('IV.csv', 'w') as IVFile:
That “with” starts a block that encloses the file operations. When the code inside the block finishes, the file will be automatically flushed and closed - even if an exception happens that causes the code to exit early. Nothing Earth shattering.
   serialport.write(("0"+chr(13)).encode())
    valuestring = serialport.readline()
The Arduino program takes a number from 0 to 1023 to set the duty cyle of the pulse width modulated output - from 0 shortest (0V output) to 1023 longest (5V output.) It automatically makes a set of measurements and send back the results after it receives a PWM value. The first one is usually garbage, so the Python program throws it away.
 for counter in range(0 , 1023):
        serialport.write((str(counter)+chr(13)).encode())
        valuestring = serialport.readline()
        stringvalues = valuestring.split(('\t').encode())
Run through all PWM values. For each PWM value, process the returned ADC values. The Arduino returns the values as a tab separated list of values in a particular order. The variable “stringvalues” is a list that contains all the returned voltages.
        vBias = (float(stringvalues[0])/1023) * 5 / 256
        vBase = (float(stringvalues[1])/1023) * 5 / 256
        vCollector = (float(stringvalues[2])/1023) * 5 / 256

        print("Count: " + str(counter) + " VBias= " + str(vBias) + " VBase= " + str(vBase) + " VCollector= " + str(vCollector))
That calculates the voltages from the measured ADC values. It assumes that the ADC of the Arduino is using a 5V reference (and that it is accurate, which it may not be.) The “/256” there at the end is the final step of the oversampling that I’ve mentioned before.
The “print” is just there to keep me from being bored while the program is running.
        IBase = ((vBias-vBase)/1000)
        ICollector = (5.0-vCollector)/1000.0
        #Amperes to milliamperes
        IBase = IBase * 1000.0
        ICollector = ICollector * 1000.0
Using the collected voltages, calculate the current through various parts of the circuit. Again, this assumes a 5V system. It also assumes that the resistors are 1000 ohm parts - that’s the “/1000” part. It looks stupid to divide by 1000 then turn around and multiply by 1000. The math gives you values in amperes, and I want milliamperes. Yeah, I could combine it and eliminate the multiplication step. That’d only work as long as I stay with 1000 ohm resistors, though.
IVFile.write( str(V) + "\t" + str(vBias) + "\t" + str(vBase) + "\t" + str(IBase) + "\t" + str(ICollector) + "\r\n")
Finally, write the voltages and the calculated current to a tab separated text file.
It’s really just a throw away command line script so that I could get started. The GUI version will be done better.
I use Libre Office Calc to make the actual plots.
If you are doing a diode plot (the only thing really worth bothering with in the current state of the plotter,) then you’ll need to plot $vBase$ against $IBase$. That’s columns C ($vBase$) and D ($IBase$.) I’m not going to give you a tutorial in using Calc. Just this much: You’ll want to sort by $vBase$, and use an XY plot with just lines. If you know how to use Calc, then you know what I mean. If you don’t know what I mean then just hang on for a few days while I get the graphical program finished up.
With a little patience and some twiddling in Libre Office Calc, you can produce diode IV plots like this one:
| Red LED IV plot |
|---|
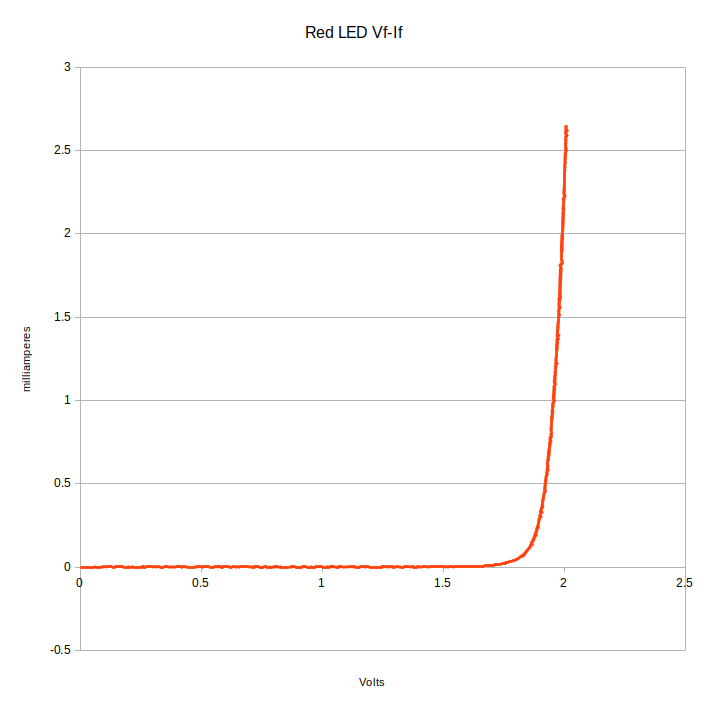 |
Edit 2020-01-06 I’ve moved all the code to a new repository after finally giving the project a name. The software is also much improved over the preview.
I have put the GUI program in a new repository on GitHub. It is no where near finished, but it can make an IV plot of a diode or LED. Consider it a preview - at the current stage (6 December, 2020) it is very much a work in progress. I’ll add a note here when I get it finished, and it will (of course) get its own blog post as an introduction.
| Sneak preview |
|---|
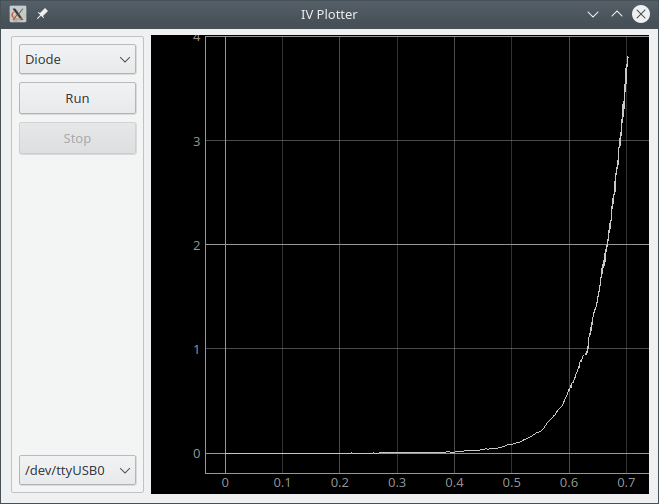 |
Building an IV plotter from an Arduino Nano - Table of Contents