Building an IV plotter from an Arduino Nano - Back on track and making progress
A functional tracer with revised hardware and software.
Building an IV plotter from an Arduino Nano - Table of Contents
After wrasslin’ with ‘gators for a while, I got back on track and concentrated on making a fully functional IV tracer.
I have expanded the hardware, and made a lot of progress on the software side.
First the hardware changes.
As I said in my last post on the IV tracer, it takes two controlled signals to make an IV plot.
This revised circuit (and some changes to the Arduino program) can now generate a variable base current and a variable collector voltage.
| Revised tracer circuit |
|---|
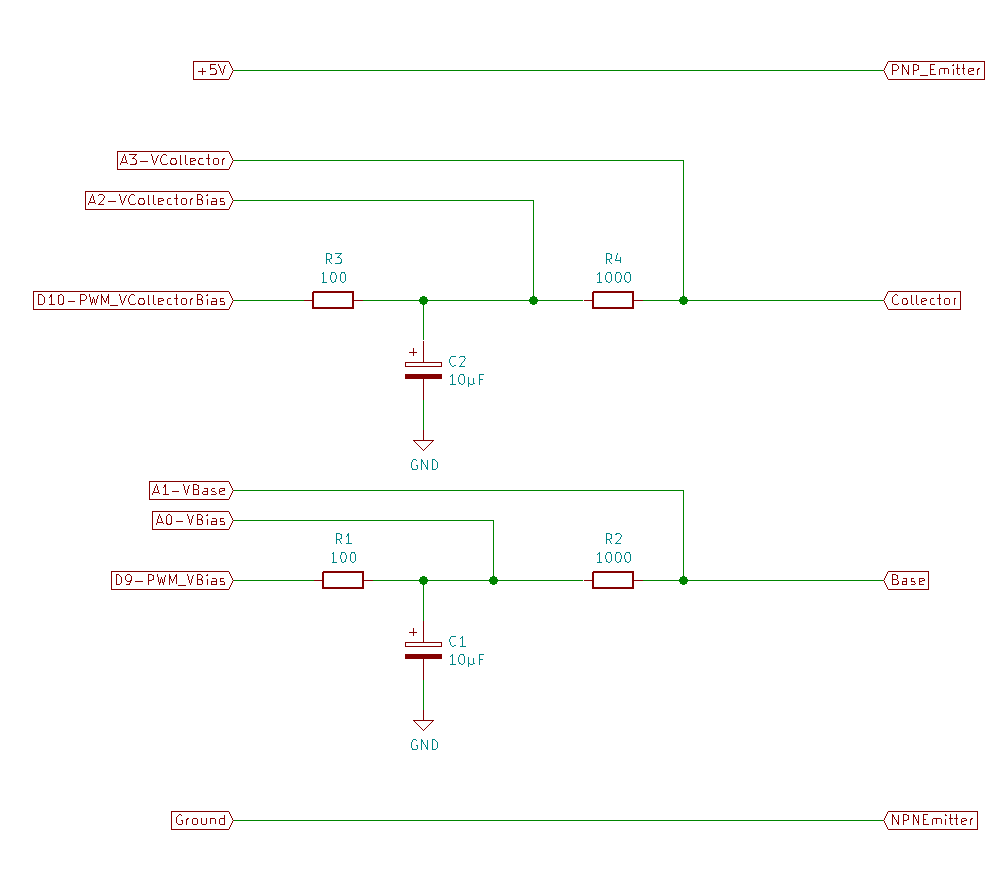 |
Yes, you read that diagram right. It’ll do PNP as well as NPN transistors - and, of course, diodes.
| NPN setup |
|---|
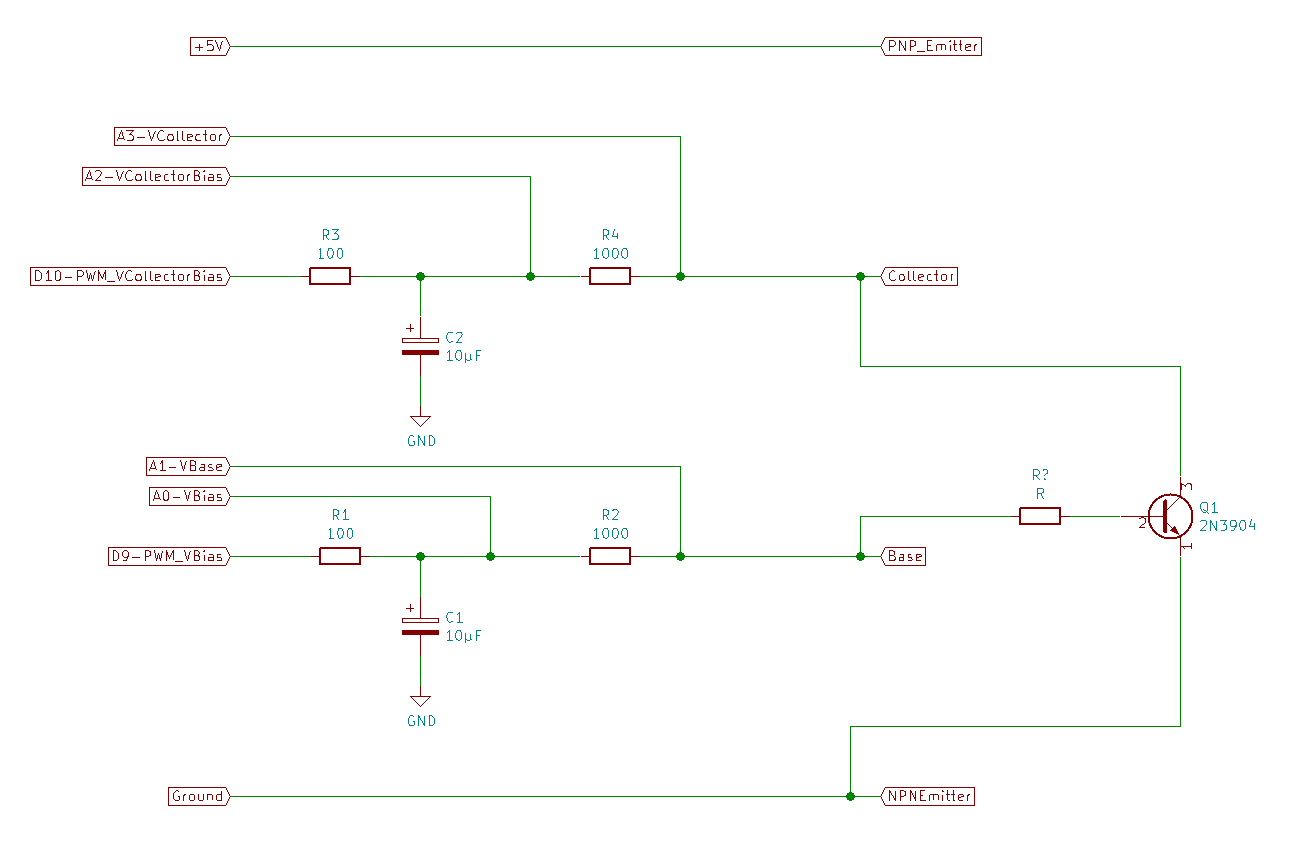 |
| PNP setup |
|---|
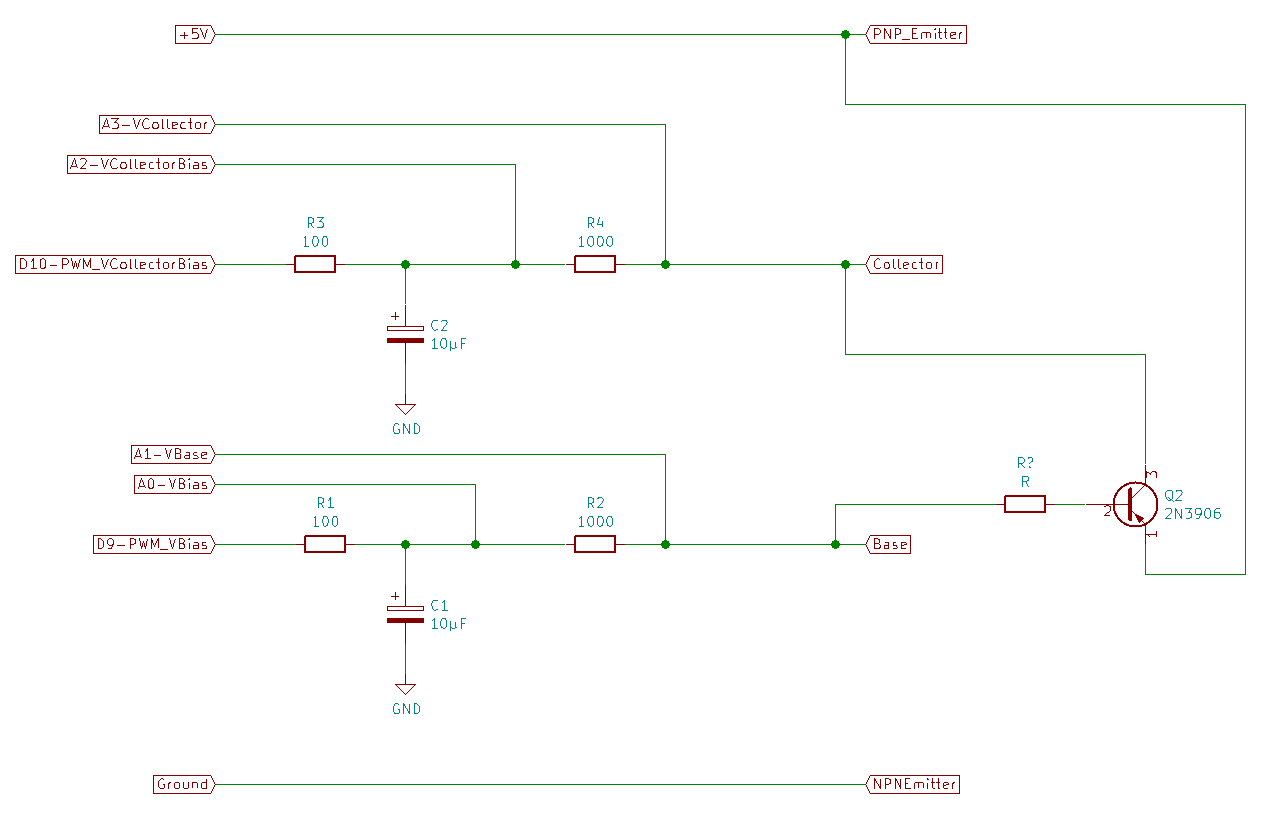 |
In operation, VCollector runs from 0 to 5V for the NPN, and 5V to 0 for the PNP. In both cases, the result is an increasing voltage between the collector and emitter.
You’ll notice I’ve included a base resistor for the transistors. You need that. The current gain of typical signal transistors is so high that the collector current can quickly exceed the 4 milliamperes or so that the tracer bias can supply.
The revised software looks like this:
| Qt IV Plotter |
|---|
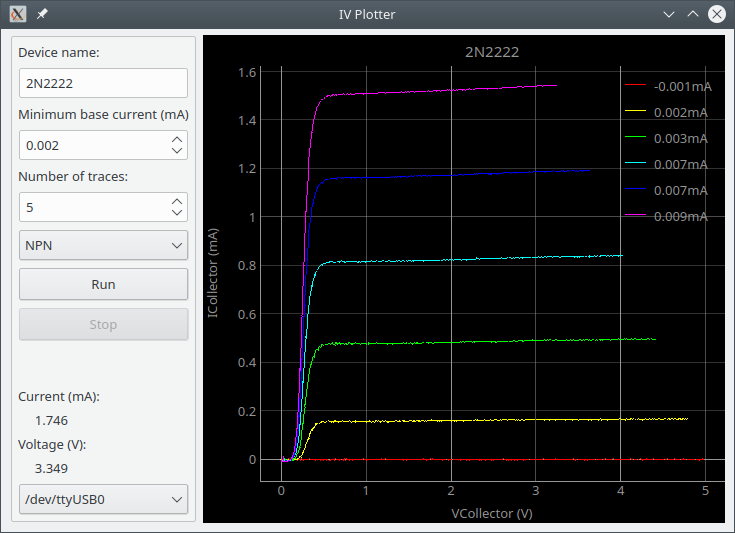 |
That screenshot was made of a 2N2222 (NPN) transistor trace. I used a 470k base resistor to keep the collector current from getting out of hand.
Look down at the lower left corner and you’ll see a couple of fields marked “Current” and “Voltage.” Those are measurements of the plot data. Point the mouse at a spot on the plot, read off the values.
This image of a 2N3906 (PNP) trace was made using the “export image” function of the pyqtgraph “PlotWidget” that I use to display the charts.
| 2N3906 |
|---|
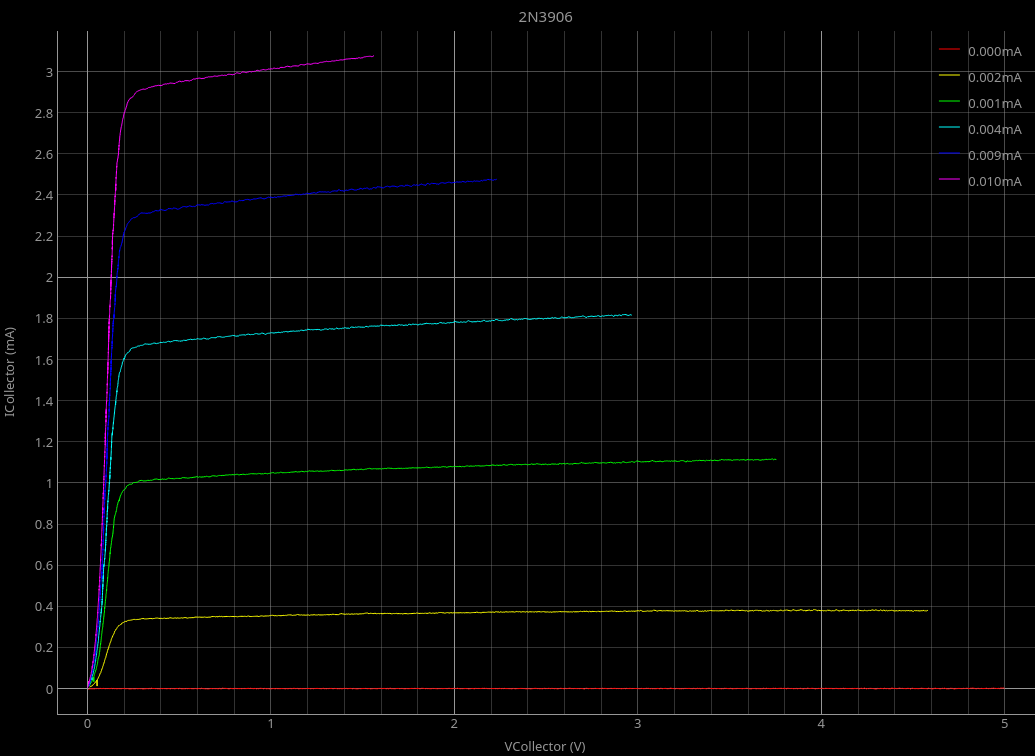 |
“PlotWidget” includes a whole lot of handy features and functions. Besides the cursors and the grid and the image export, it can also export .csv files of the plotted data. I’m still going to implement a “save/open” function - “PlotWidget” can export .csv, but it can’t read it back in.
The legend in the upper right corner inadvertently shows the limitations of my hardware. For reasonable collector currents, I have to use base currents in the single digit microampere range. That’s right at (or just beyond) what the Arduino can measure, even with oversampling.
The base current is set by slowly increasing the VBias applied to the 1k series resistor and measuring VBase. The software calculates the current from the voltages and the series resistor. When the calculated current goes above the given minimum, it divides the rest of the VBias range into the given number of steps.
As the program runs through VBias, it measures IBase. The IBase values are given in the legend. As you can see, the measured values of IBase are rather wonky. I’m going to have to do a little more oversampling there. Oversampling IBase won’t hurt (too) much. It is only measured at the start of each trace. That’s like maybe a couple of hundred milliseconds in all. Against a total trace time of several minutes, that won’t hurt at all.
Something else that “PlotWidget” provides is a zoom function. You can pan and zoom all over the plot to see details.
I didn’t expect any kind of really fine details in a transistor IV plot, but the 2N2222 shows some kind of funky “tail” for low collector voltages.
| Tail zoom |
|---|
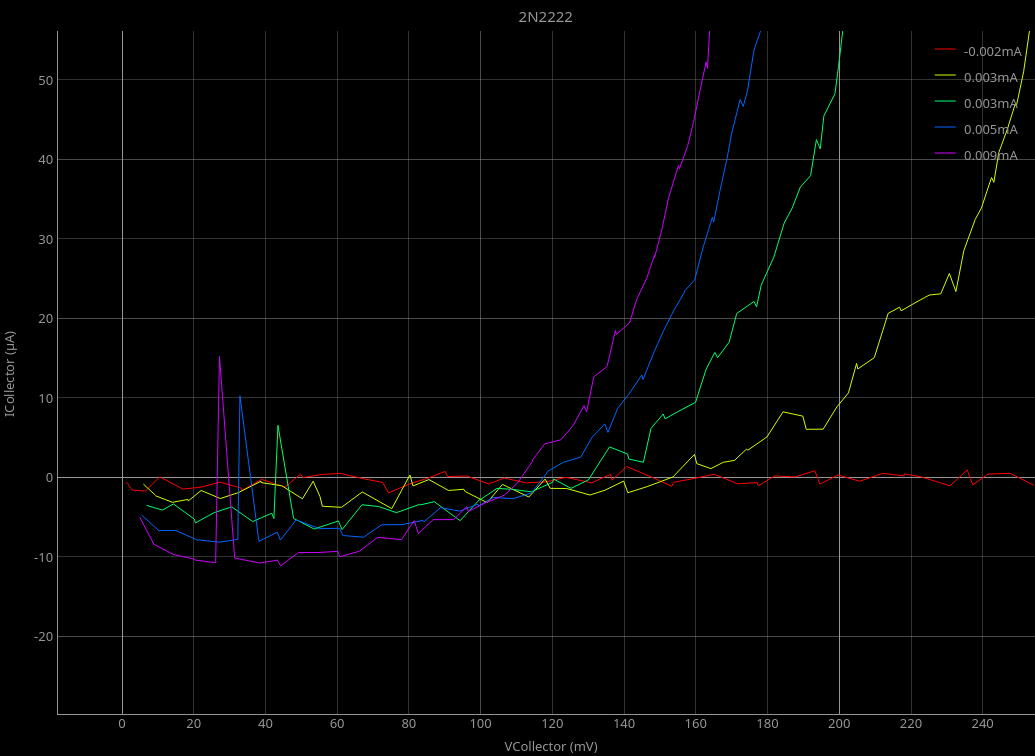 |
I think the tail is real, though it probably doesn’t go negative. The purple and blue plots show it most clearly. The collector current seems to drop down then come back up for collector voltages between 0 and about 60 millivolts.
I’ll have to look into that one day - but not tonight.
I don’t know enough about how IV traces are used to be able to tell if the available current and voltage ranges are enough to be useful. I should be receiving a copy of “The Art of Electronics” soon, and I’ll look into how transistor amplifiers are designed using the IV curves. I’ll try designing a simple amplifier and see if the curves from my little toy here are useful or not.
At any rate, that’s all for today.
Edit: 3 Janaury 2021: I’ve combined the two projects and moved them to a new repository named Rodriguez. I deleted the old repositories.
The Arduino software is available in the “Rodriguez” folder of the “Rodriguez” repository.
The Qt IV Plotter software is available here (renamed to “Rodriguez.”)
Building an IV plotter from an Arduino Nano - Table of Contents