Making use of an inexpensive pulse oximeter
Not a necessity, but certainly useful.
I bought a pulse-oximeter a while back to scratch my curiousity itch about the effectiveness of CPAP therapy.
Sleep apnea causes you to stop breathing at night. In some people, it is a physical problem - the airway gets blocked, leading to snoring and poor breathing. In other people, it is a neurological problem in that the reflex that should cause you to breath takes a break - you “forget to breathe.”
In either case, not breathing leads to a lack of oxygen in the blood. Besides the disturbance to your sleep that the poor breathing causes, the lowered blood oxygen level can cause damage to your organs. Apnea does not merely make you tired from lack of sleep, it also literally slowly kills your organs. On top of that, your heart works harder to keep enough blood circulating so that what oxygen you do get makes to where it needs to go.
When you have an apnea evaluation done, one of the things measured will be your blood oxygen saturation. The usual way to do that is with a pulse oximeter.
I’m sure there was such a measurement made before I was prescribed my first CPAP-machine, but there hadn’t been one done since (I did go through a home test a couple of weeks ago, which convinced my doctor to schedule me for a new evaluation coming up next month.)
Back in November, I was having some trouble with my CPAP machine, and got to wondering if it was really doing anything for me.
These days, there are quite a few options for monitoring blood oxygen levels in your sleep. Many of these are expensive and they try to keep your data locked away - they show you a summary of the data, but do not allow for an easy export of the raw data. The FitBit my wife has is like that. It shows you a funky “sleep monitor,” but if you want to see the raw pulse rate and oxygen level data, you have to submit a request and wait for your data to be sent to you in an e-mail.
I chose an inexpensive pulse oximeter based on the mistaken assumption that it would be supported by OSCAR since several more expensive Wellue models already had support in OSCAR. My inexpensive Wellue POD-2W was not supported by OSCAR - the Viatom/Wellue ViHealth software stores the POD2 data in a different format than it uses for the more expensive devices.
Since I had the thing, I thought I’d just go ahead and see if I could implement support for the POD2 in OSCAR. It’d help me out, and possibly make it possible for people with lower income to have a look at their oxygen levels.
| Wellue POD-2W |
|---|
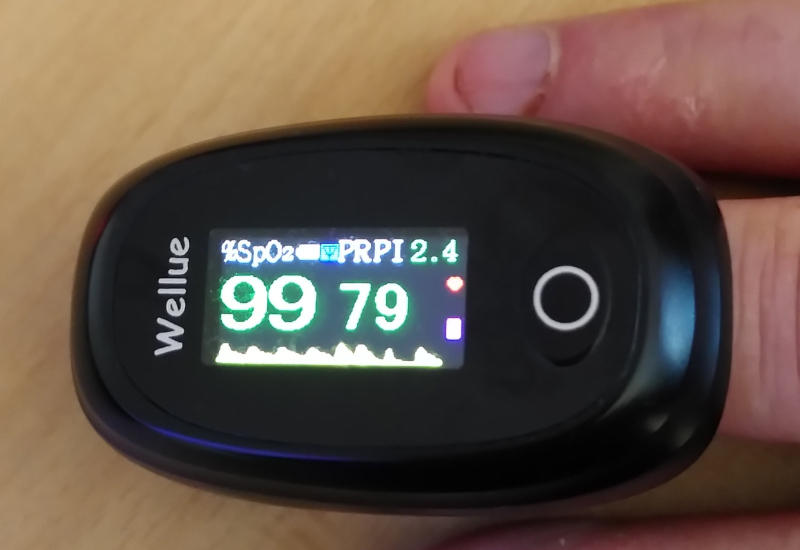 |
The device itself shows several measurements:
- %SpO2 - percentage of oxygen saturation - 99%
- PR - pulse rate - 79 beats per minute
- PI - perfusion index - 2.4%
Those first two are pretty self explanatory. The third one isn’t often seen, though it is important. It’s main importance for monitoring your oxygen saturation and your pulse rate is that a low perfusion index means low blood circulation. Poor blood circulation means that the measured values may be incorrect. A perfusion index above 1% should be fine. Below that, you may want to “take the measurement with a grain of salt.”
The data is from the POD2 is stored in a binary file whose content looks like this:
| Binary data |
|---|
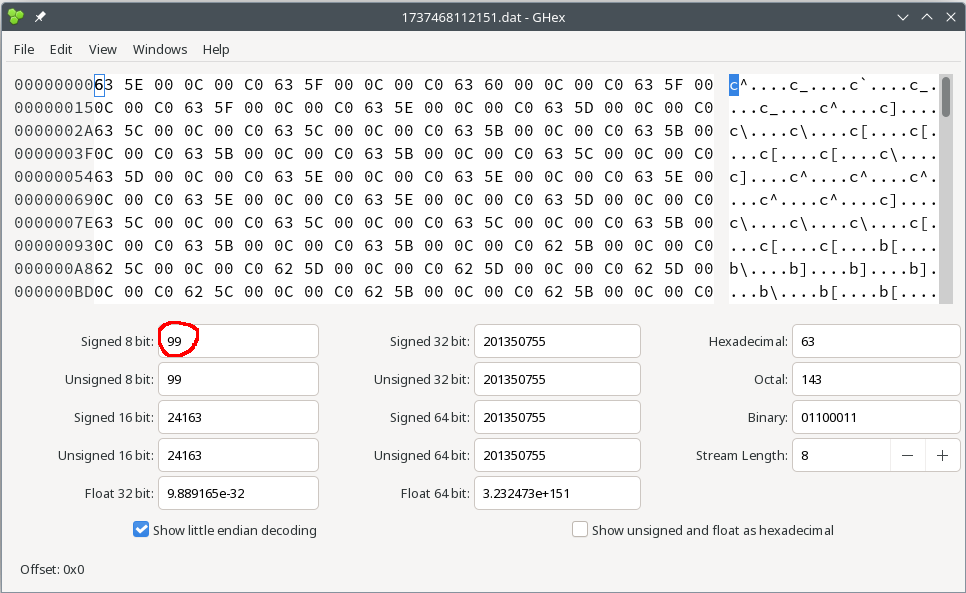 |
The first time I looked at it, I was trying to match it to the OSCAR program code for the Wellue O2 Ring. I kept trying to make sense of the header of the file - the O2 Ring file has a header that describes the data and time and tells you what model device was used. I kept looking and thinking that the first bytes ought to tell me something about the format.
The next time I went to look at it, I happened to have the thing on my finger while scrolling through the values. I noticed that the first byte (0x63) had the same decimal value (99) as the SpO2 shown on the device. I also noticed a repeating pattern in the data - 0x63 is ASCII character “c”. That “c” repeats every six bytes in the data.
It turns out that there’s no header. All values are simply a byte value with the measurement. The data for the POD2-W is simply a set of bytes. No header, no time stamp. Just a series of byte records.
Resizing the display area in the hex editor emphasizes the repeating nature of the data blocks:
| Data blocks |
|---|
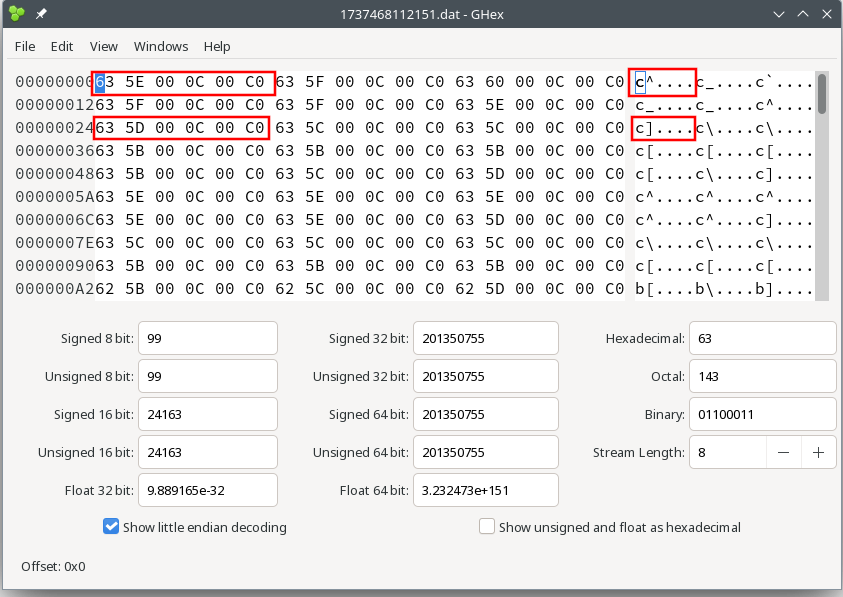 |
Now knowing that the data are in a simple format, it was fairly simple to match the bytes in each record to the displayed values:
| Byte number | Content |
|---|---|
| 0 | oxygen saturation in percent |
| 1 | pulse rate in beats per minute |
| 2 | unknown1 - it always shows zero in my data |
| 3 | perfusion index in percent * 10 |
| 4 | unknown2 - always zero in my data |
| 5 | battery charge level in the upper two bits |
As an example, here’s the decoded results of one data record:
| Byte number | Hex value | Decimal value | Result |
|---|---|---|---|
| 0 | 63 | 99 | 99% SpO2 |
| 1 | 5E | 94 | 94 beats per minute |
| 2 | 00 | 0 | unknown |
| 3 | 0C | 12 | 1.2% perfusion index |
| 4 | 00 | 0 | unknown |
| 5 | C0 | 192 | Fully charged battery |
The battery value corresponds to the battery charge indicator from the display. The display has three bars, so a total of four states. Only the highest two bits of the battery level value matter. For “C0”, the binary value is 0b11000000. The top two bits are 0b11. That’s a decimal value of 3, indicating all three battery segments on the display are lit.
That’s a start, but there’s still some important stuff missing. There’s no timestamp in the data, and nothing to indicate the start time or the interval between measurements.
Did you notice the filename from the hexdump? That’s “1737468112151.dat.” The filename without the extension is a Unix timestamp in milliseconds. Using an online Unix timestamp decoder gives a date and time of Tue Jan 21 2025 15:01:52 GMT+0100 (Central European Standard Time.) That matches the start time for one of my earliest experiments with the POD2.
The Viatom ViHealth app actually has an export function, though I don’t use it. The exported data is incomplete - it does not include the perfusion index or the battery level.
The exported data from the ViHealth app does, however, include a timestamp. Those timestamps show that the data are in one second intervals.
That’s got all the puzzles solved - data decoded, start time, sampling rate. That was sufficient to implement an import in OSCAR.
Here are the OSCAR charts of the data from my first night using the pulse oximeter:
| Pulse oximeter charts |
|---|
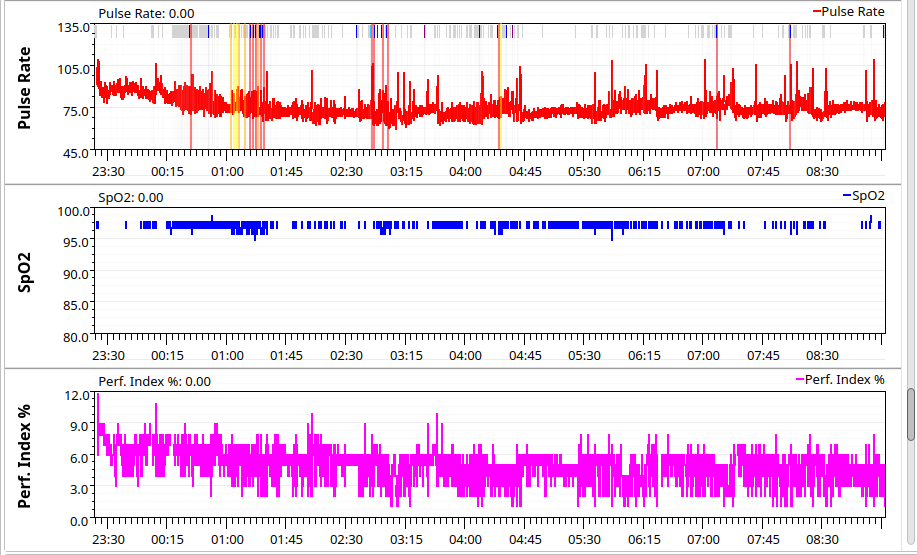 |
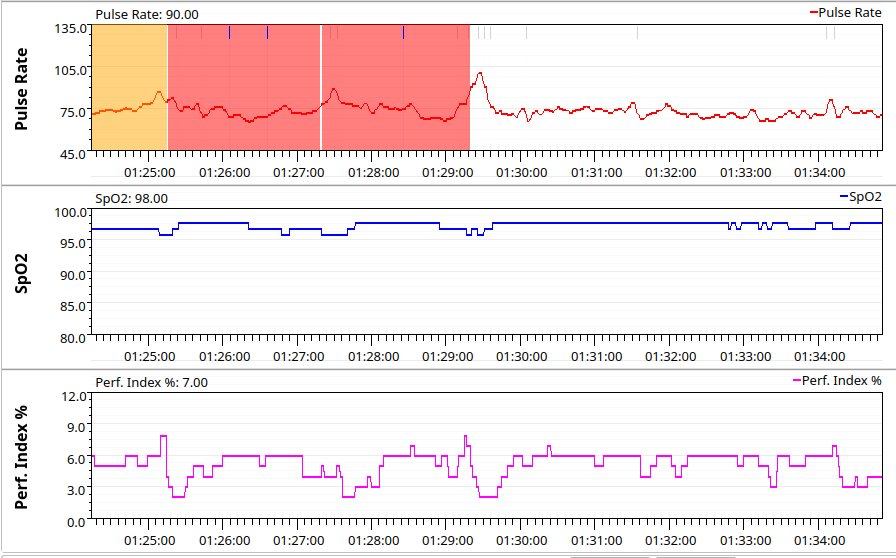 |
The first chart is the whole night. The second chart is a zoomed in section from about 01:24 AM to about 01:34. You can easily zoom in and see details, along with the correct time.
More interestingly, you can see CPAP events along with the pulse oximeter data. The yellow bars in the charts represent respiratory effort-related arousal events (RERA) while the red bars indicate epoch severe obstructions (eSO.) An eSO occurs when you have a hard time breathing for two minutes - it isn’t an apnea, but it does greatly disturb your sleep.
As you can see, the RERA caused a slight rise in heart rate while the eSO caused the heart rate to jump to well over 100.
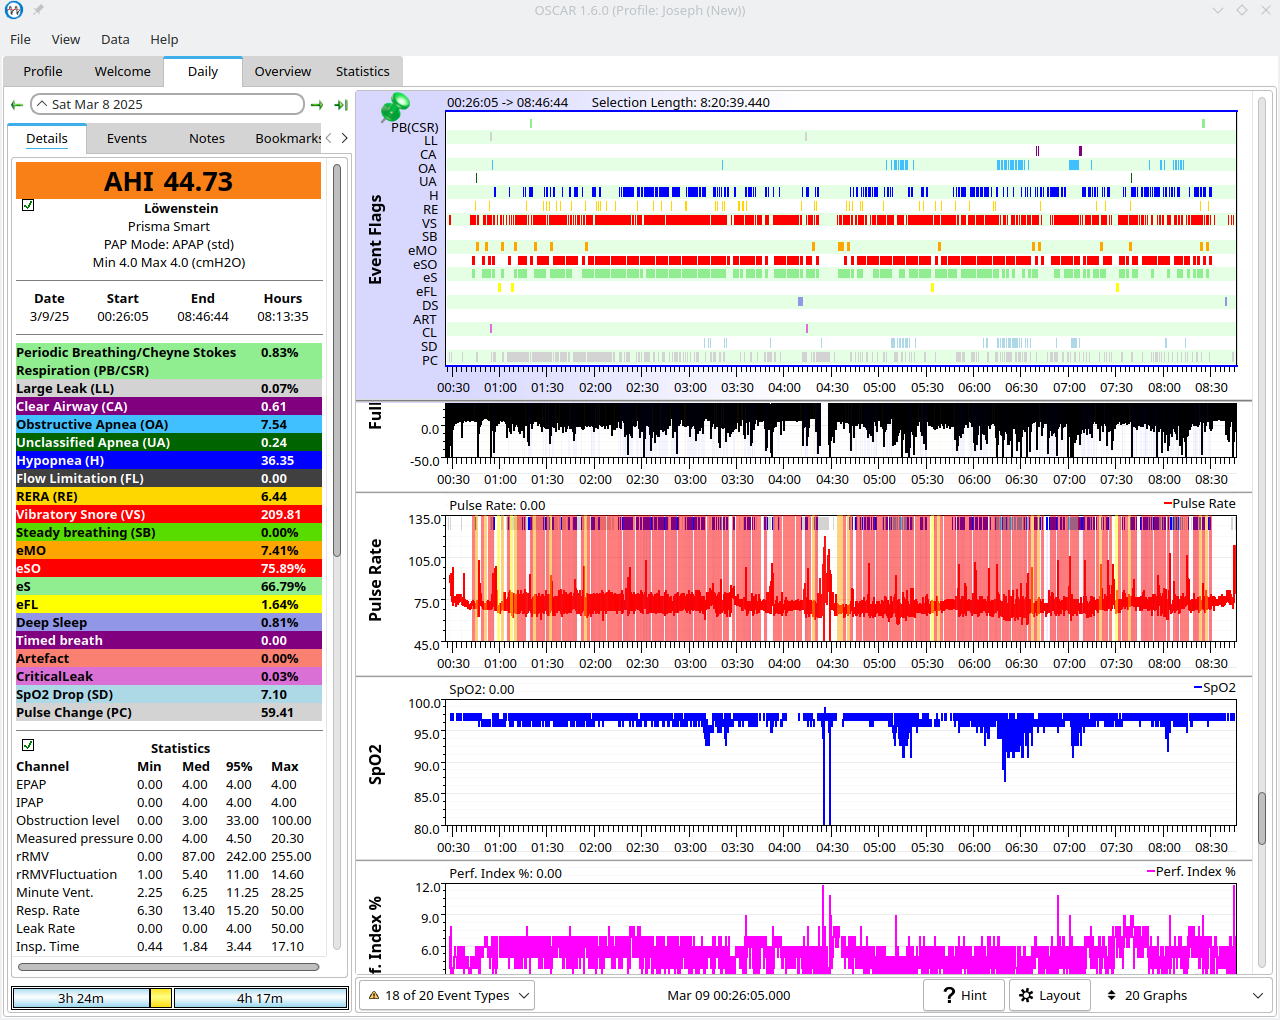
With the import working properly, we can take a look at the interesting things. Interesting to me is whether the CPAP is really doing anything.
All the charts from nights with the CPAP show that my blood oxygen stays above 95% - that’s good. That doesn’t tell me if the CPAP is working, though. To see that, I need a comparison.
For a comparison, I “nerfed” my CPAP machine. I set the pressure to a fixed 4 cmH2O. That’s the minimum the machine can produce. It is far too low to do anything for my apnea.
Rather than the AHI (apnea score) of around 4 that I usually have, that one night had an AHI of about 45.
| Bad night |
|---|
 |
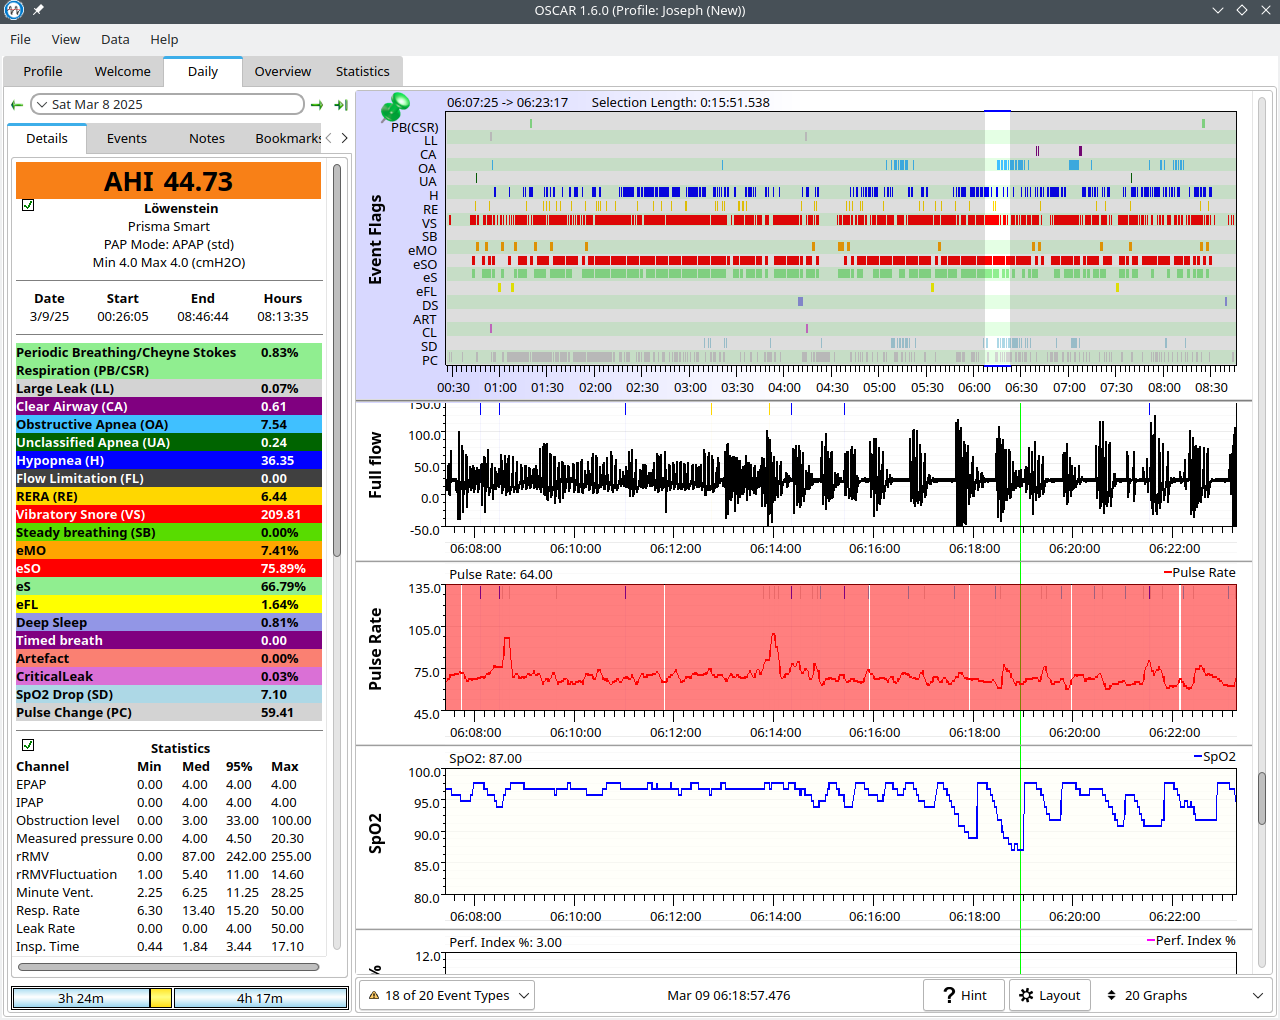 |
That clearly show some large drops in blood oxygen. At about 06:19, the blood oxygen drops to a low of 87 percent. Interestingly enough, the heart rate stays fairly stable during that time. At earlier times in the night, the pulse rate went up when the oxygen content went down, even though the drop was less severe. At a guess, I’d say my body had given up at that point. Just “eh, whatever” and went on sleeping rather than trying to get in more oxygen.
That confirms that the CPAP works for me. The blood oxygen concentration stays near optimal levels on CPAP, then goes all to pieces without CPAP.
You may notice that the battery values are not shown in OSCAR. That’s because I didn’t import them. OSCAR looks at the battery values during import and warns you if the battery dropped to zero, but that’s all. The battery value is irrelevant for the health aspects. It only matters in so far as the time stamps are worthless if the battery runs down.
The ViHealth software cannot tell if a value was skipped. It assumes that the data records come in at 1 per second all the time. When the battery runs down, it will skip records and may “sleep” for several minutes before the batteries recover a bit and it starts sending data again.
In the ViHealth app, this has the effect that the chart will show the correct start time, then the stop time for when you stopped the recording. It then stretches the data to fill the whole chart. As an example, if the battery runs down one hour after you start the recording, but you leave it running for a full 8 hour night, then the app will stretch the 3600 data samples for that first hour out over the entire 8 hours.
The same data imported into OSCAR will trigger a warning on import, then show a short night with just one hour of data.
This is an OSCAR chart from a night when I forgot to recharge the batteries in the POD2:
| Dead batteries |
|---|
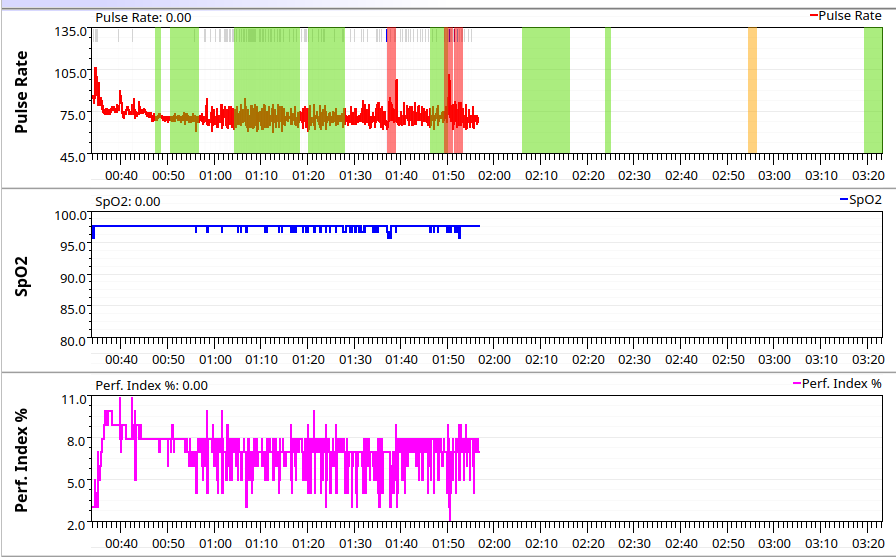 |
It correctly shows that there’s far less than a full night’s data, and OSCAR gave me a low battery warning when I imported the data.
Do you remember the perfusion index? Here’s the reason why the import includes it:
| Perfusion index |
|---|
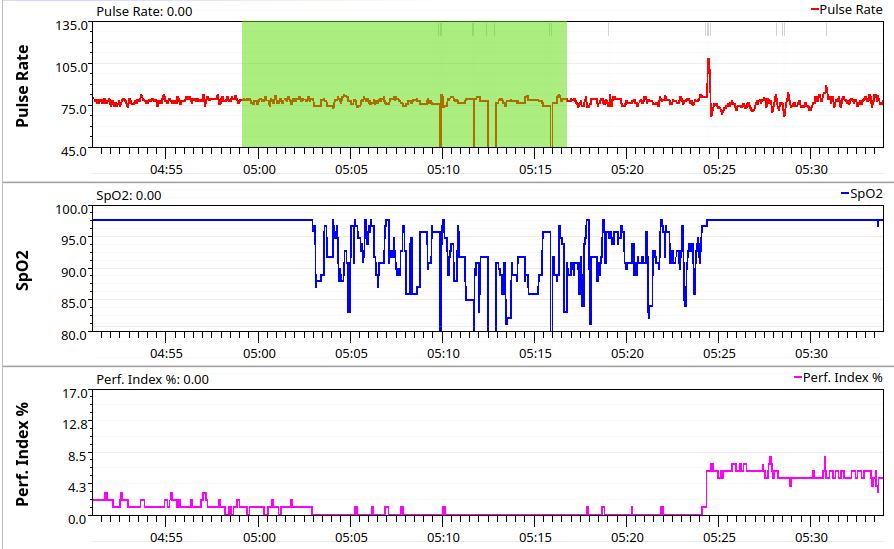 |
There’s a fairly major blood oxygen drop a little after 05:00 AM. Without the perfusion index, there’d be no way to tell if the blood oxygen or the pulse rate are OK. With the perfusion index, you can see that the blood oxygen measurement is incorrect due to poor circulation (or poor observation.) There’s no need to start looking for a medical problem when there’s a simpler explanation - the hand with the pulse oximeter was out in the cold, or the pulse oximeter was pushed out of place and unable to make accurate measurements. From the way the perfusion index jumps from zero to six in just 8 seconds, I’d say that the pulse oximeter was just out of place for a while and that I pushed it back where it belonged in my sleep (most likely accidentally.)
I wouldn’t depend on a POD2 if I needed serious monitoring for a real problem, but it does well enough to scratch my curiousity itch - and maybe someone will pick one up because it’s cheap and discover a problem that would have otherwise gone unnoticed.
I wear the POD2 most nights, though I don’t really need to. Most of what it tells me, I see already in the other OSCAR charts - when OSCAR flags a severe breathing obstruction, I don’t need to see an oxygen drop to know that it is a bad thing.
Mostly, I keep using the POD2 to make sure that I’ve gotten the import correct. You can never be sure what a device is going to do or what oddities an accidental misuse might cause. I keep using it on the off chance something may crop up that needs to be fixed.
The Viatom/Wellue POD2 import has been submitted to the OSCAR developers to be included in a future version. Until then, you can check out the source code from the official OSCAR repository at GitLab and try it out (assuming you know how to use QT-Creator to compile the project.)