Photographing the invisible - software to display what the hardware saw
A work in progress.
RF camera and radio telescope - Table of Contents
I am currently working on a (rather large) program to make microwave images. As I’ve mentioned, the name of this program is Grote, and it is very far from being finished.
Before there was Grote, there was scanner.py. That is a simple program I wrote that works with Karl to do the physical scanning and read the RF intensity. This simple program writes the data to a CSV file and generates a simple gray scale image. It can’t switch frequency ranges or polarization, but I can send the commands for that to Karl through a terminal program and then use scanner.py to make images with the manually selected settings.
Grote can’t yet make scans. There’s a lot of other functionality that I want Grote to have, so I have a lot of low level things to do in Grote before I get to the point of actually using it to make images.
I’ll show what Grote can currently do, then explain what I want it to do when I’m done.
Current state of Grote
Right now, the most useful thing Grote can do is to display the files that scanner.py generates.
| Window image analysis |
|---|
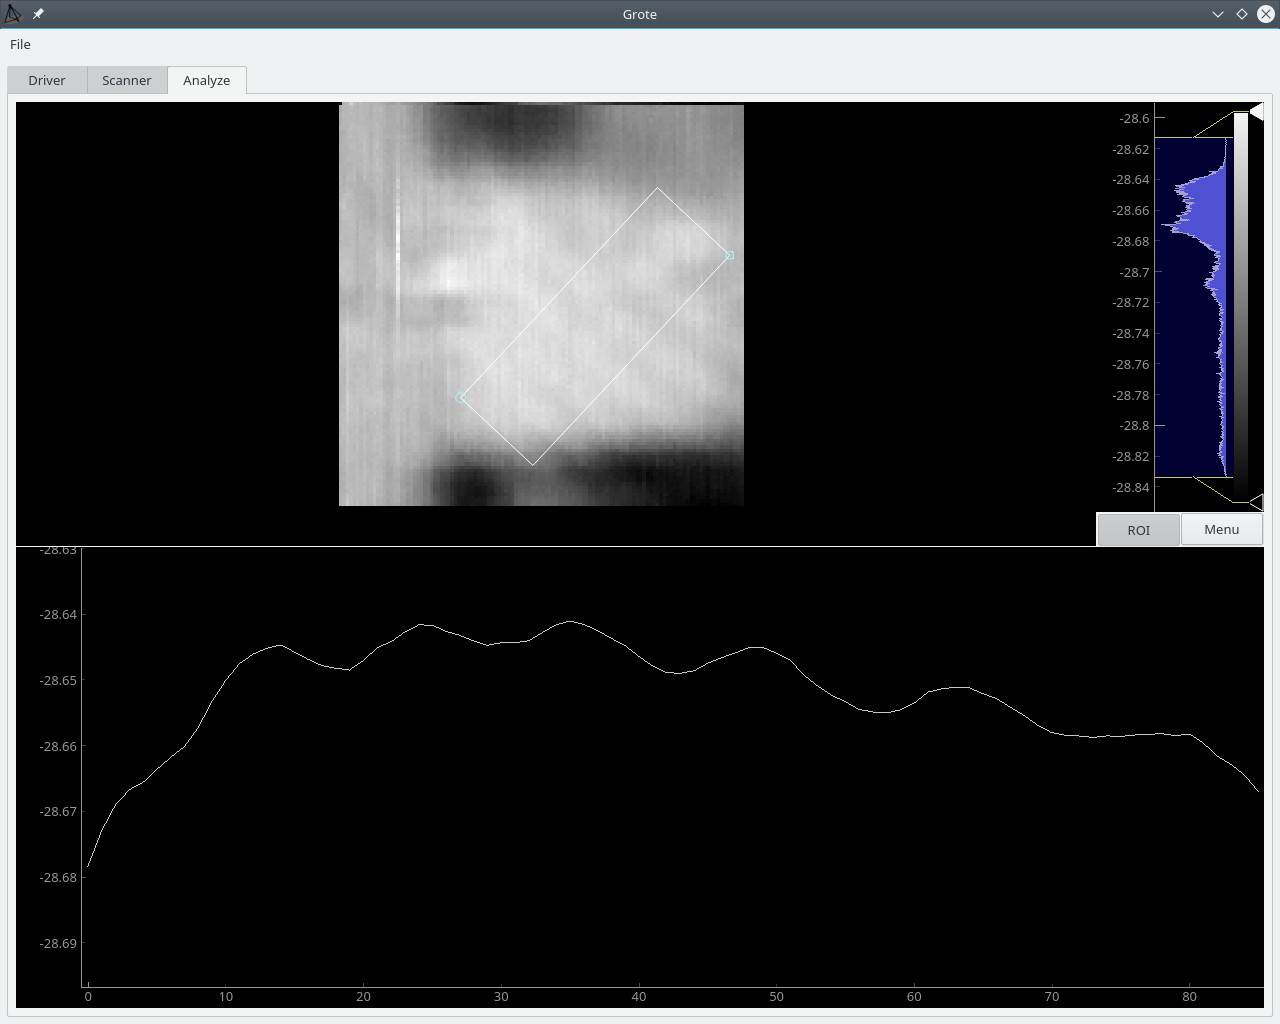 |
That is an image I’ve already shared, except that this is what you see while using Grote rather than an exported image. It shows the window in my work room as seen by the microwave camera. There are waves that run diagonally across the window, but they are only visible with a certain polarization (I’ve forgotten whether horizontal or vertical.)
In any case, the ripples are there, but they are difficult to see in the image. Grote uses pyqtgraph to display the collected data. The ImageView widget accepts arrays of data, and generates gray scale images from it. The ImageView Widget has a “region of interest” (ROI) selector that is very handy.
The ROI is the diagonally placed rectangle in the upper part of the image. The lower half of the image is a section of the data as selected by the ROI box. The ROI shows the ripples much better than the image does. The numbers along the left edge also show just how slight those ripples are - they are only 0.02dBm “high.” Karl’s ability to resolve very small variations in RF intensity is all that allows me to pick up that kind of thing. Grote’s ability to manipulate the data makes it possible to see and analyse that level of detail.
Along the right hand side is ImageView’s histogram. The associated sliders allow me to change the contrast to make details easier to see. Besides changing contrast, it can also make snazzy false color images:
| False color |
|---|
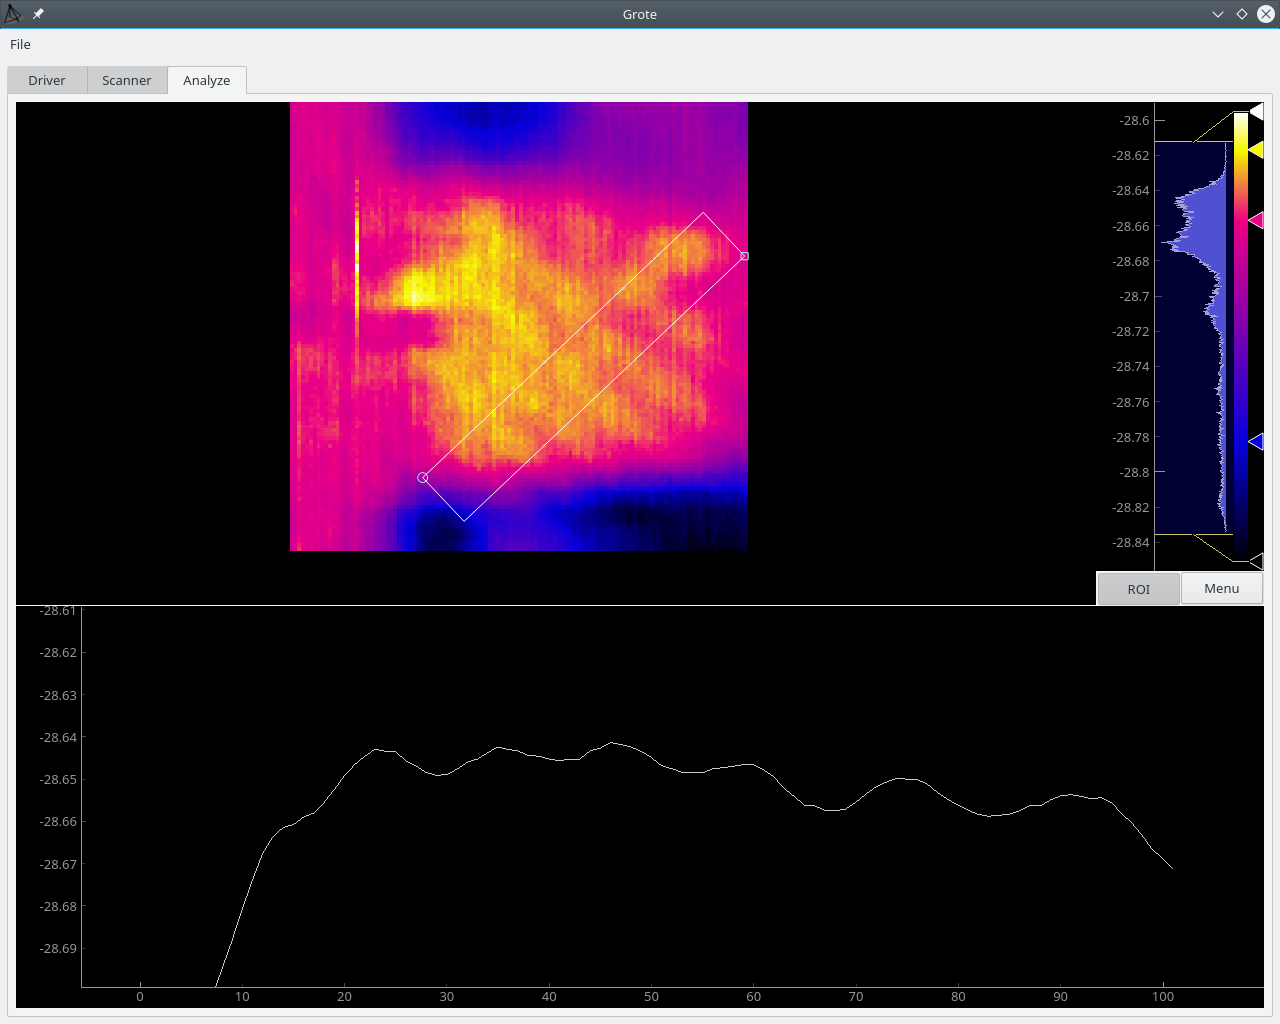 |
The ROI section doesn’t change in response to the histogram adjustments. The ROI always goes to the data behind the image.
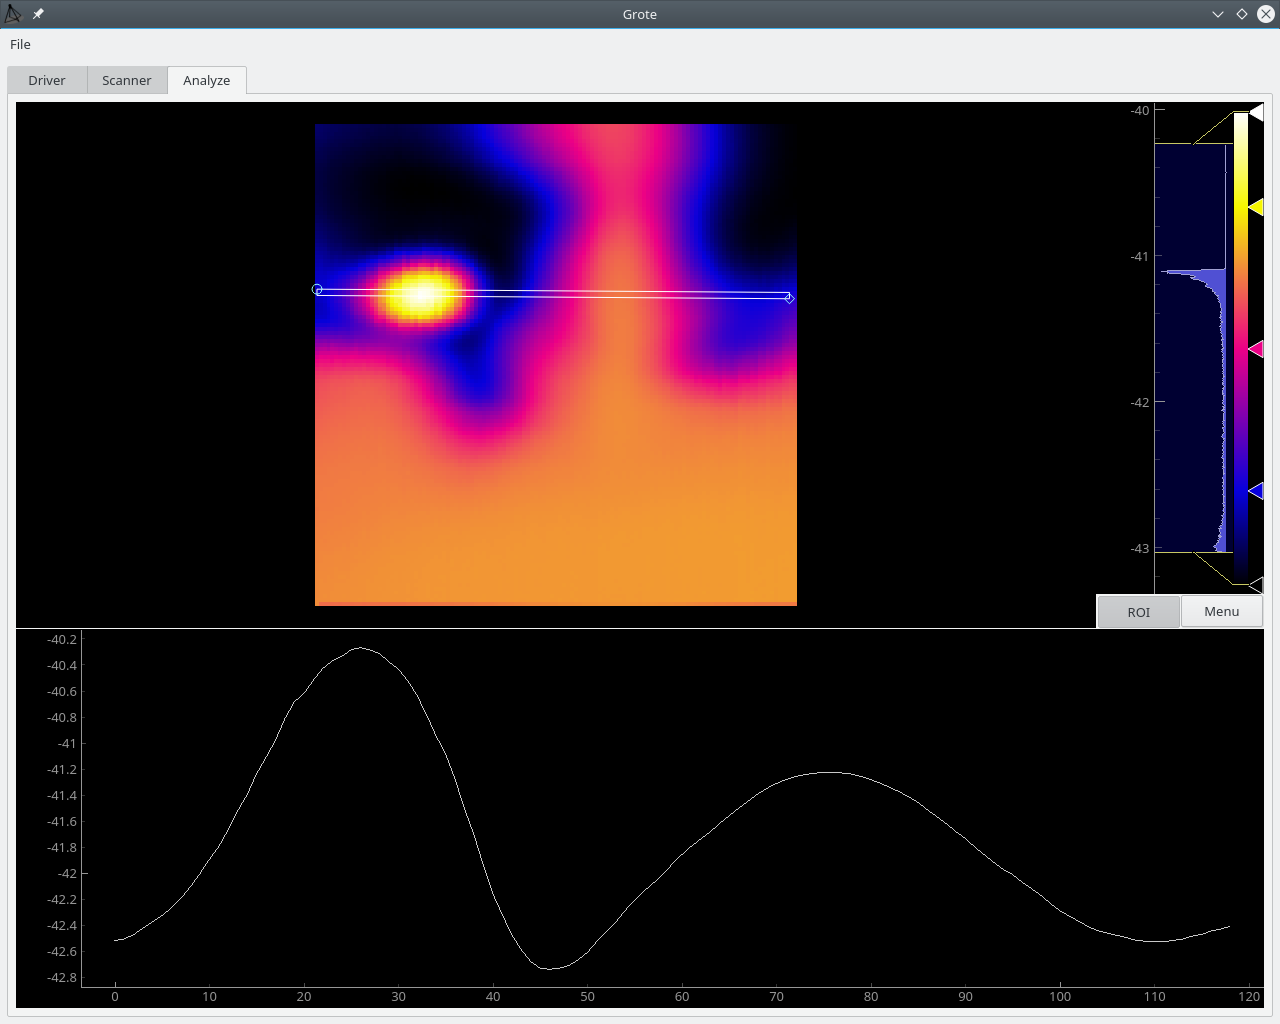
Here’s the moon in false color compared to the moon in grayscale:
| Moon in false color |
|---|
 |
| Moon in gray scale |
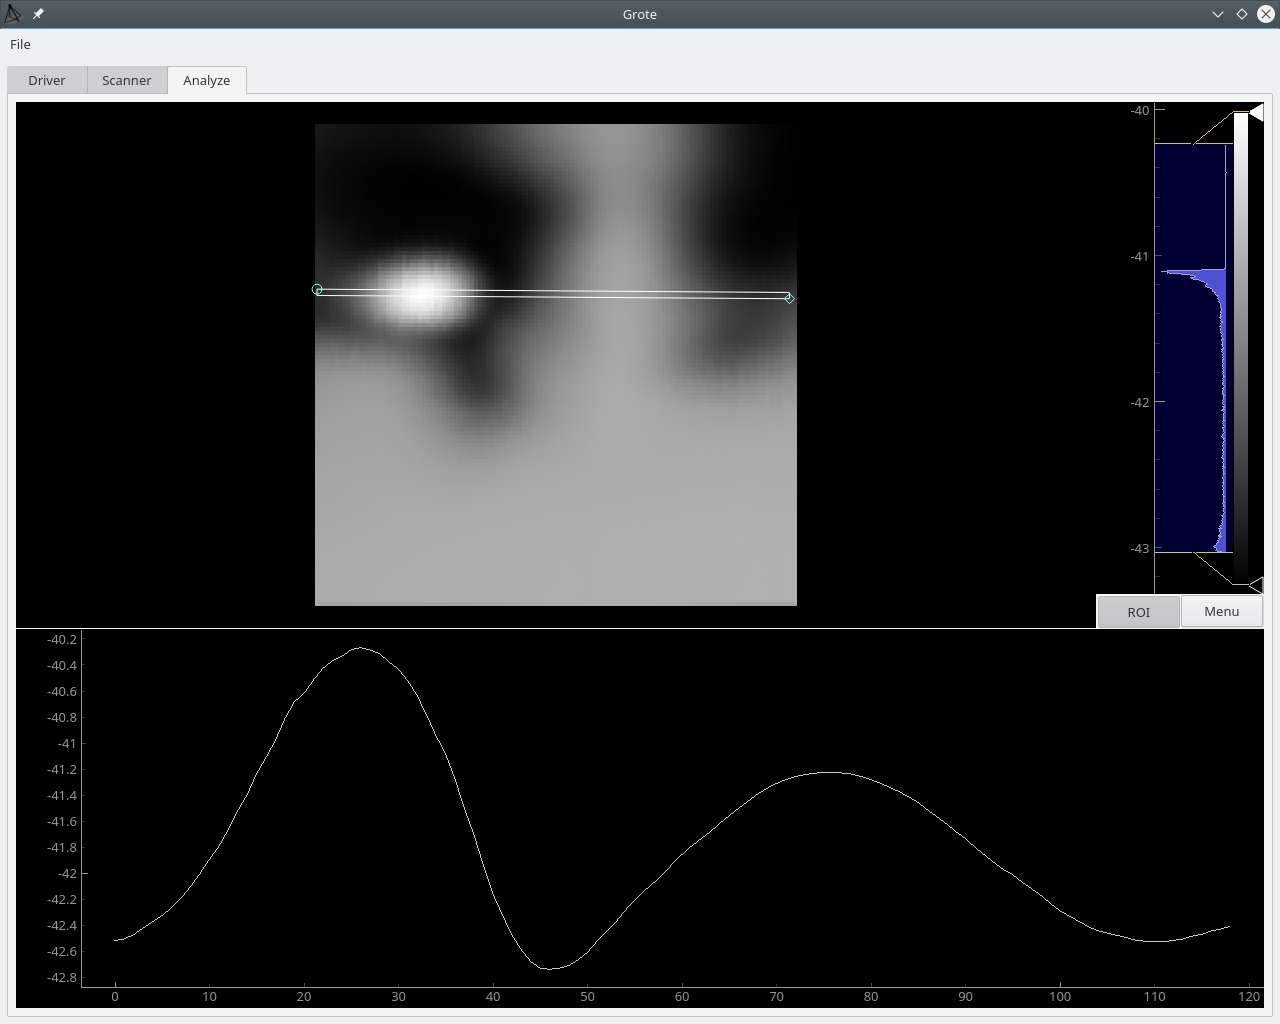 |
It’s easier to see that the Moon is much brighter than the trees in the false color version. In either case, the ROI shows that the Moon is 1dBm brighter than the trees.
Looking at those images, I noticed that the outdoors images are all around -40dBm while the indoor images are all around -28dBm. I don’t recall changing the hardware or software in such a way to make such a drastic difference. I’m going to have to make some indoor and outdoor images again and compare them to see if I’m really getting “roasted” by 0.00001 watts of microwave power from every direction inside my house.
Outside of that, Grote has really only two other completed functions. There’s the driver selection and setup section, and there’s the scanner section with one completed scanner and one half completed scanner.
Here’s the driver selection and setup view:
| Driver selection and setup |
|---|
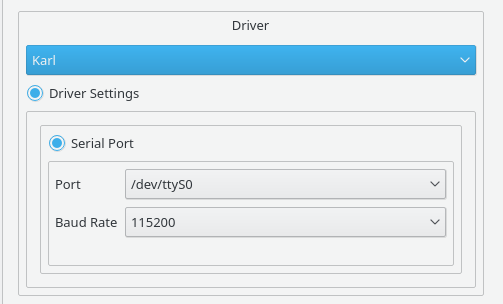 |
Right now, the only driver available is Karl. I intend to make a “Karl junior” that only reads intensity but doesn’t have servos - it would be a cheaper version of the Karl hardware, maybe something schools could build and operate. I also intend to build a Raspberry Pi version of the hardware someday. Grote would run on the Pi, and the driver would take over all of the functions that Karl now has. It would (of course) require a Pi “hat” for the ADC and other things but would eliminate the Arduino.
The scanner section is where the actual work of capturing data is done. It looks like this:
| Scanner selection and setup |
|---|
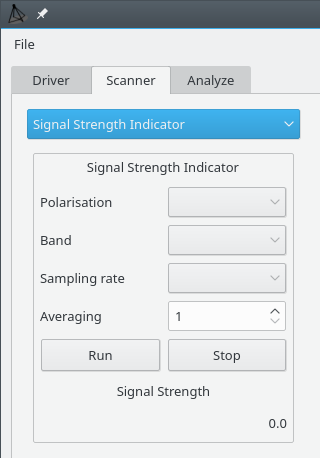 |
The idea is to have different operating modes that produce data and save it for later processing.
The only scanner that currently works is the “signal strength indicator.” It lets you manually change bands and polarization, and continuously displays the detected RF level. The next step is to implement a calibrator that will let me calibrate the hardware so that I can make temperature measurements. From there it goes on to the first real scanner (replacement for scanner.py) that will make microwave photographs. Then I’ll get to the really difficult part - the astronomical scanner that will make long scans to map microwave sources in the sky.
Future plans for Grote
In the short term, I need to finish the temperature calibrator and then a simple “thermometer scanner.” After that is the “photo scanner” to replace scanner.py.
Something that is planned, but not yet even hinted at in code or GUI is the processing workflow. I intend to use the “visual programming flowcharts” from pyqtgraph to make a set of building blocks to process images and sky scans. The idea is to be able to apply certain transformations (contrast, thresholding, etc.) to the individual layers (the bands and polarizations) in a dataset, then combine those layers to make colored images. There will also be a deconvolution block to sharpen the scan results.
The flowchart thing is rather long term, though. Before that, I need to get the scanners working. Along the way, I also need to define a file format. I do not intend to store the data as images, or as CSV files. The idea is to record usable data for scientific analysis. The file format will have to contain the calibration data, as well as data about the time, date, and location the data was collected and the settings used. Additionally, each data point will have a time stamp and the X/Y coordinates from Karl as well as the recorded intensity. The data points will also contain the frequency band and polarization information.
That description of the future isn’t very long, but I have some idea of what is involved and I expect each part of it to be a lot of work. It keeps getting pushed off because I write software all day at work and just don’t have any desire to program more when I get home. It’s easier to fiddle with hardware or noodle around writing blog posts when I get home than to write more code after a full day of writing code at work.
Future experiments with the microwave camera
Grote and Karl provide me with an opportunity to carry out experiments that no one else can do. I intend to replicate some of the more well known experiments in optics, and also just poke around and see what I can find that’s interesting.
Things I intend to do (besides the obvious astronomy stuff) :
- Replicate the double-slit experiment.
- Replicate some of the known polarization effects.
- Attempt to build a microwave spectrometer using a diffraction grating
I think that will all be enough to occupy all of my spare time for some years to come.
I’ll post updates in the future as I make progress on Grote, and explain the software as I develop it along with the experiments I carry out with it.
For now, I’m going to do something not quite completely different. There’s a question on the Electrical Engineering stack exchange that gave me another idea, and I’m going to scurry off and do that first.