Building an IV plotter from an Arduino Nano - Generating the bias voltage with stone knives and bearskins
Use what you’ve got.
Building an IV plotter from an Arduino Nano - Table of Contents
Since I started this project on a Saturday evening, I was restricted to just what I had available. That included an Arduino Nano and lots of passive components.
The first problem in making the IV tracer was to generate a varying DC voltage using just the things I had available.
It is common knowledge that Arduinos don’t have a real analog output. They have pulse width modulated (PWM) digital outputs that are misleadingly called “analog outputs.”
The thing about PWM is that you can make an analog signal out of it with a simple low pass filter. Filter out the pulses, and you get a voltage that is the average of the pulses. For a low duty cycle output, you get a low DC value. For a high duty cycle output, you get a high DC output.
The rub is that “low pass filter.” The standard PWM frequency of the Arduino is 480 Hz. A simple low pass RC filter that can clean that up would have to have a very low cutoff frequency in order to be effective.
Another problem is that the Arduino PWM outputs only have 255 steps in the duty cycle. That’s a little too little for what I want.
The Arduino Timer1 library gives you more options when generating a PWM signal. I’ve used it before, so I know that it has a 10 bit (1023) step range on the PWM output as well as being much more flexible about the output frequency.
I experimented a little, and decided that a PWM frequency of 10kHz worked well.
The low pass filter is a simple RC filter made with a series resistor of 100 ohms shunted by 10µF. That gives it a “cutoff” frequency of about 160Hz. I put cutoff in scare quotes because with its attenuation rate it is more of a “squish” or “mash” off than a cutoff.
The bias generator looks like this:
| Bias generator circuit |
|---|
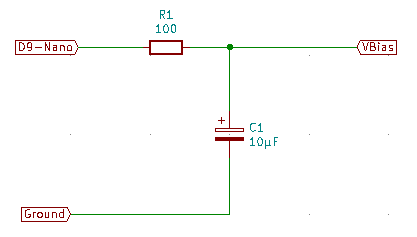 |
Simple and crude - stone knives and bear skins level.
For very low or very high duty cycles, it works just fine.
| High duty cycle output |
|---|
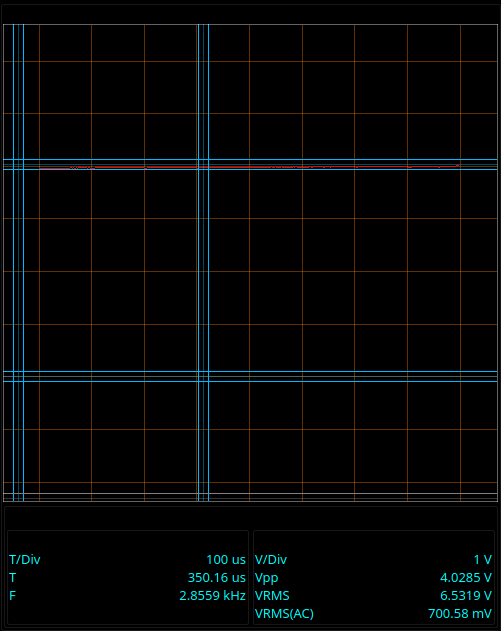 |
That’s at a duty cycle of 100% (1023.) It’s generating about 4 volts. There’s some loss because of the 100 ohm resistor and the load (1k into the base of a transistor) but that’s OK because I measure that voltage while doing IV traces. I use the measured values for (almost) all voltages in the IV tracer - what it is rather than what it should be.
It doesn’t look so good at duty cycles in the middle, though:
| Middle duty cycle output |
|---|
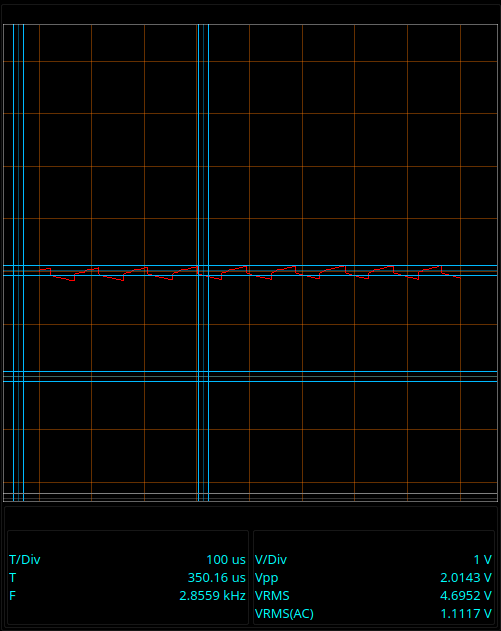 |
That looks down right ratty. The filter isn’t as effective as I’d like it to be - but it works. You’ve seen the plots. They aren’t jagged.
| Not jagged |
|---|
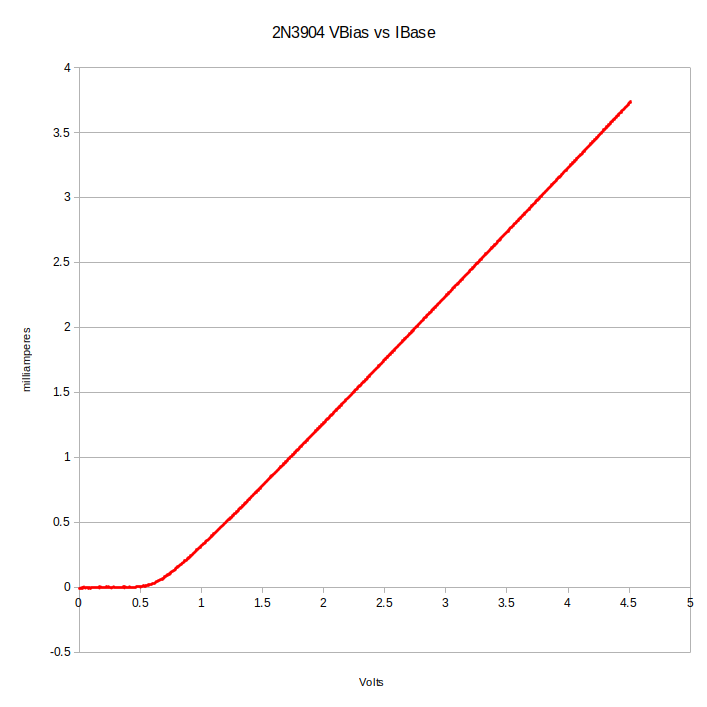 |
The reason for that is that I am using oversampling to get better than 10 bit resolution on the voltage measurements.
For each voltage measurement, the program actually reads the analog input 256 times. It takes an average of 256 values. Besides getting the resolution closer to 14 bits than to 10 bits, it also acts as a low pass filter. The end result is that while it takes a fairly long time to do a sweep, the plots are very smooth.
Each plot consists of 1023 points - a complete sweep of the entire PWM duty cycle range of the Timer1 PWM driver.
The data points are measured with the equivalent of a 14 bit ADC, giving a voltage resolution of 0.3 millivolts compared to the normal 5 millivolt resolution using the standard Arduino analogRead method.
The higher resolution of the PMW duty cycle and the higher resolution of the oversampled ADC values makes for a very smooth plot that can easily capture and present the sharp changes in current and voltage that occur at certain points in the IV curve of a transistor or diode.
The oversampling does come at the cost of longer sweep times - there ain’t no such thing as a free lunch, if you know the saying - but I find the wait worth the result.
Next time around I’ll go into how the IV tracer gets the current measurements.
Building an IV plotter from an Arduino Nano - Table of Contents